Reading ENVI_MET files#
Scott Wales, CLEX CMS
Let’s take a look at reading the output of the ENVI_MET microclimate model, as described at http://www.envi-met.net/hg2e/doku.php?id=filereference:edx_edi
Outputs consist of pairs of files - .EDX xml file containining metadata for a single output time, and .EDT files containing binary data.
Reading metadata#
Let’s start out with the .EDX metadata. XML is pretty easy to read in python - https://docs.python.org/3.6/library/xml.etree.elementtree.html
Note we need to define the file encoding, since it’s using special characters (degrees symbol)
import xml.etree.ElementTree as ET
parser = ET.XMLParser(encoding='ISO-8859-1')
meta = ET.parse('UrbanLayout_noIVS_AT_23.00.01 23.07.2013.EDX', parser=parser).getroot()
Specific XML nodes can be accessed using .find(), which takes a path. Get the text inside the node with .text
A bit of simple text processing gets a list of variable names
variable_names = meta.find('variables/name_variables').text.strip().split(',')
variable_names
['Objects ( )',
 'Flow u (m/s)',
 'Flow v (m/s)',
 'Flow w (m/s)',
 'Wind Speed (m/s)',
 'Wind Speed Change (%)',
 'Wind Direction (deg)',
 'Pressure Perturbation (Diff)',
 'Air Temperature (°C)',
 'Air Temperature Delta (K)',
 'Air Temperature Change (K/h)',
 'Spec. Humidity (g/kg)',
 'Relative Humidity (%)',
 'TKE (m²/m³)',
 'Dissipation (m³/m³)',
 'Vertical Exchange Coef. Impuls (m²/s)',
 'Horizontal Exchange Coef. Impuls (m²/s)',
 'Vegetation LAD (m²/m³)',
 'Direct Sw Radiation (W/m²)',
 'Diffuse Sw Radiation (W/m²)',
 'Reflected Sw Radiation (W/m²)',
 'Temperature Flux (K*m/s)',
 'Vapour Flux (g/kg*m/s)',
 'Water on Leafes (g/m²)',
 'Leaf Temperature (°C)',
 'Local Mixing Length (m)',
 'Mean Radiant Temp. (°C)',
 'TKE normalised 1D ( )',
 'Dissipation normalised 1D ( )',
 'Km normalised 1D ( )',
 'TKE Mechanical Turbulence Prod. ( )',
 'Stomata Resistance (s/m)',
 'CO2 (mg/m3)',
 'CO2 (ppm)',
 'Plant CO2 Flux (mg/m²s)',
 'Div Rlw Temp change (K/h)',
 'Building Number ()']
Get the array dimensions - we need to manually convert these to numbers with int()
nr_xdata = int(meta.find('datadescription/nr_xdata').text)
nr_ydata = int(meta.find('datadescription/nr_ydata').text)
nr_zdata = int(meta.find('datadescription/nr_zdata').text)
nr_ndata = int(meta.find('variables/Data_per_variable').text)
Reading binary files#
Now we have the metadata, let’s read the actual data. This is stored as a binary file of little-endian floating point numbers, which can be read with numpy
import numpy
data = numpy.fromfile('UrbanLayout_noIVS_AT_23.00.01 23.07.2013.EDT','<f4')
Sanity check - did we read the expected number of values?
len(data) == len(variable_names)*nr_xdata*nr_ydata*nr_zdata*nr_ndata
True
Currently the data is just a 1d array. .reshape() it to the proper shape, as defined in the format documentation
cube = data.reshape((len(variable_names), nr_zdata, nr_ydata, nr_xdata, nr_ndata))
cube.shape
(37, 24, 100, 100, 1)
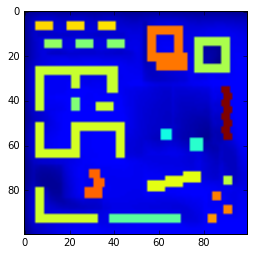
Another sanity check - field 8 is supposed to be temperature, are the values reasonable? Make sure the axes aren’t flipped
t = cube[8,:,:,:,:]

%matplotlib inline
import matplotlib.pyplot as plt
plt.imshow(t[0,:,:,0])
print(t.min(), t.mean(), t.max())
22.4075 23.7675 30.7352

The xarray library is similar to Pandas, but for multiple dimensions. Create a dataset, so that we can access variables by their names rather than the index:
import xarray

ds = xarray.Dataset({name: (['x','y','z','n'], cube[idx,:,:,:,:]) for idx, name in enumerate(variable_names)})
ds
<xarray.Dataset>
Dimensions:                                  (n: 1, x: 24, y: 100, z: 100)
Dimensions without coordinates: n, x, y, z
Data variables:
    Objects ( )                              (x, y, z, n) float32 0.0 0.0 ...
    Flow u (m/s)                             (x, y, z, n) float32 0.488468 ...
    Flow v (m/s)                             (x, y, z, n) float32 0.512861 ...
    Flow w (m/s)                             (x, y, z, n) float32 0.00120439 ...
    Wind Speed (m/s)                         (x, y, z, n) float32 0.708258 ...
    Wind Speed Change (%)                    (x, y, z, n) float32 102.205 ...
    Wind Direction (deg)                     (x, y, z, n) float32 223.604 ...
    Pressure Perturbation (Diff)             (x, y, z, n) float32 2.91062 ...
    Air Temperature (°C)                     (x, y, z, n) float32 22.4075 ...
    Air Temperature Delta (K)                (x, y, z, n) float32 -0.100772 ...
    Air Temperature Change (K/h)             (x, y, z, n) float32 -1.02646 ...
    Spec. Humidity (g/kg)                    (x, y, z, n) float32 9.87292 ...
    Relative Humidity (%)                    (x, y, z, n) float32 60.434 ...
    TKE (m²/m³)                              (x, y, z, n) float32 0.169738 ...
    Dissipation (m³/m³)                      (x, y, z, n) float32 0.0270205 ...
    Vertical Exchange Coef. Impuls (m²/s)    (x, y, z, n) float32 0.117289 ...
    Horizontal Exchange Coef. Impuls (m²/s)  (x, y, z, n) float32 0.117289 ...
    Vegetation LAD (m²/m³)                   (x, y, z, n) float32 0.0 0.0 ...
    Direct Sw Radiation (W/m²)               (x, y, z, n) float32 0.0 0.0 ...
    Diffuse Sw Radiation (W/m²)              (x, y, z, n) float32 0.0 0.0 ...
    Reflected Sw Radiation (W/m²)            (x, y, z, n) float32 1.83102e-17 ...
    Temperature Flux (K*m/s)                 (x, y, z, n) float32 -999.0 ...
    Vapour Flux (g/kg*m/s)                   (x, y, z, n) float32 -999.0 ...
    Water on Leafes (g/m²)                   (x, y, z, n) float32 -999.0 ...
    Leaf Temperature (°C)                    (x, y, z, n) float32 -999.0 ...
    Local Mixing Length (m)                  (x, y, z, n) float32 0.41409 ...
    Mean Radiant Temp. (°C)                  (x, y, z, n) float32 14.3769 ...
    TKE normalised 1D ( )                    (x, y, z, n) float32 6.42722 ...
    Dissipation normalised 1D ( )            (x, y, z, n) float32 4.02007 ...
    Km normalised 1D ( )                     (x, y, z, n) float32 10.2757 ...
    TKE Mechanical Turbulence Prod. ( )      (x, y, z, n) float32 0.0554855 ...
    Stomata Resistance (s/m)                 (x, y, z, n) float32 -999.0 ...
    CO2 (mg/m3)                              (x, y, z, n) float32 646.296 ...
    CO2 (ppm)                                (x, y, z, n) float32 357.65 ...
    Plant CO2 Flux (mg/m²s)                  (x, y, z, n) float32 0.0 0.0 ...
    Div Rlw Temp change (K/h)                (x, y, z, n) float32 9.54501 ...
    Building Number ()                       (x, y, z, n) float32 -999.0 ...
General read function#
Here’s a function that ties all of this together. It also adds a time value from the metadata. Similarly, if the x and y co-ordinates are known they can be added to the coords argument of xarray.Dataset.
import os
import pandas
import numpy
import xarray
import xml.etree.ElementTree as ET

def open_edx(filename):
    """
    Open a EDX/EDT dataset

    Returns an xarray dataset
    """
    # Parse the metadata file
    parser = ET.XMLParser(encoding='ISO-8859-1')
    meta = ET.parse(filename, parser=parser).getroot()

    variable_names = meta.find('variables/name_variables').text.strip().split(',')

    nr_xdata = int(meta.find('datadescription/nr_xdata').text)
    nr_ydata = int(meta.find('datadescription/nr_ydata').text)
    nr_zdata = int(meta.find('datadescription/nr_zdata').text)
    nr_ndata = int(meta.find('variables/Data_per_variable').text)

    date = meta.find('modeldescription/simulation_date').text.strip()
    time = meta.find('modeldescription/simulation_time').text.strip()

    # Get the time
    t = pandas.to_datetime(date+' '+time, format='%d.%m.%Y %H:%M:%S')

    # Read the data file
    data = numpy.fromfile(os.path.splitext(filename)[0]+'.EDT','<f4')
    cube = data.reshape((len(variable_names), nr_zdata, nr_ydata, nr_xdata, nr_ndata, 1))

    # Create a dataset
    dataset = xarray.Dataset({name: (['z','y','x','n','time'], cube[idx,:,:,:,:])
                              for idx, name in enumerate(variable_names)},
                            coords={'time': [t]},
                            )
    return dataset
Processing data#
Individual files can be joined along the time dimension using xarray.concat()
ds1 = open_edx('UrbanLayout_noIVS_AT_22.00.01 23.07.2013.EDX')
ds2 = open_edx('UrbanLayout_noIVS_AT_23.00.01 23.07.2013.EDX')
ds = xarray.concat([ds1,ds2], dim='time')
ds.time
<xarray.DataArray 'time' (time: 2)>
array(['2013-07-23T22:00:01.000000000', '2013-07-23T23:00:01.000000000'], dtype='datetime64[ns]')
Coordinates:
  * time     (time) datetime64[ns] 2013-07-23T22:00:01 2013-07-23T23:00:01
To get a Pandas dataframe, narrow down to one dimension using .isel() then call .to_dataframe()
ds.isel(x=50,y=7,z=0,n=0).to_dataframe()
| Objects ( ) | Flow u (m/s) | Flow v (m/s) | Flow w (m/s) | Wind Speed (m/s) | Wind Speed Change (%) | Wind Direction (deg) | Pressure Perturbation (Diff) | Air Temperature (°C) | Air Temperature Delta (K) | ... | TKE normalised 1D ( ) | Dissipation normalised 1D ( ) | Km normalised 1D ( ) | TKE Mechanical Turbulence Prod. ( ) | Stomata Resistance (s/m) | CO2 (mg/m3) | CO2 (ppm) | Plant CO2 Flux (mg/m²s) | Div Rlw Temp change (K/h) | Building Number () | |
|---|---|---|---|---|---|---|---|---|---|---|---|---|---|---|---|---|---|---|---|---|---|
| time | |||||||||||||||||||||
| 2013-07-23 22:00:01 | 0.0 | 0.425640 | 0.646294 | 0.003525 | 0.773872 | 109.836174 | 213.368301 | 1.480833 | 23.992090 | 0.454916 | ... | 18.302456 | 11.21650 | 29.86492 | 0.198397 | -999.0 | 646.296021 | 359.616669 | 0.0 | 9.568902 | -999.0 |
| 2013-07-23 23:00:01 | 0.0 | 0.425784 | 0.649482 | 0.003574 | 0.776616 | 112.069305 | 213.247787 | 1.546655 | 23.017899 | 0.509627 | ... | 18.987762 | 11.88013 | 30.34774 | 0.197656 | -999.0 | 646.296021 | 358.368988 | 0.0 | 8.379407 | -999.0 |
2 rows × 37 columns
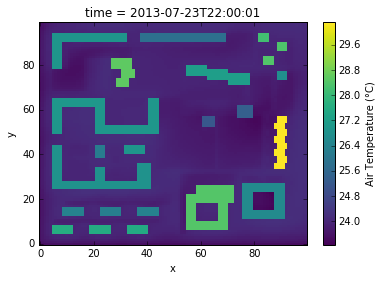
Or stay in xarray and use its plotting tools
ds['Air Temperature (°C)'].isel(z=0,n=0,time=0).plot()
<matplotlib.collections.QuadMesh at 0x7f8ab4d4e198>

